Prevalence
In epidemiology, the prevalence of a health-related state (typically disease, but also other things like smoking or seatbelt use) in a statistical population is defined as the total number of cases of the risk factor in the population at a given time, or the total number of cases in the population, divided by the number of individuals in the population. It is used as an estimate of how common a disease is within a population over a certain period of time. It helps physicians or other health professionals understand the probability of certain diagnoses and is routinely used by epidemiologists, health care providers, government agencies and insurers.
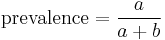
Suppose we define a as the number of individuals in a given population with the disease at a given time, and b as the number of individuals in the same population at risk of developing the disease at a given time, not including those already with the disease. Then, we can write the prevalence as
Prevalence may also be expressed in terms of subgroups of the population based on different denominator data.
Prevalence is contrasted with incidence which is a measure of new cases.
Contents |
Examples and Utility
For example, the prevalence of obesity among American adults in 2001 was estimated by the U. S. Centers for Disease Control (CDC) at approximately 20.9%. In plain English, "prevalence" simply means "extent", but in scientific English it means "proportion" (typically expressed as a percentage).
Prevalence is distinct from incidence. Prevalence is a measurement of all individuals affected by the disease within a particular period of time, whereas incidence is a measurement of the number of new individuals who contract a disease during a particular period of time. (not consistent with above formula saying prevalence is the % of people who have the disease from the total group exposed)
To illustrate, a long term disease that was spread widely in a community in 2002 will have a high prevalence at a given point of 2003 (assuming it has a long duration) but it might have a low incidence rate during 2003 (i.e. lots of existing cases, but not many new ones in that year). Conversely, a disease that is easily transmitted but has a short duration might spread widely during 2002 but is likely to have a low prevalence at any given point in 2003 (due to its short duration) but a high incidence during 2003 (as many people develop the disease). As such, prevalence is a useful parameter when talking about long lasting diseases, such as HIV, but incidence is more useful when talking about diseases of short duration, such as chickenpox.
Lifetime prevalence (LTP) is the number of individuals in a statistical population that at some point in their life (up to the time of assessment) have experienced a "case" (e.g., a disorder), compared to the total number of individuals (i.e. it is expressed as a ratio or percentage). Often, a 12-month prevalence (or some other type of "period prevalence") is used in conjunction with lifetime prevalence. There is also point prevalence, the prevalence of disorder at a more specific (a month or less) point in time. There is also a related figure lifetime morbid risk - the theoretical prevalence at any point in life for anyone, regardless of time of assessment. (example: Synopsis of article on "How Prevalent Is Schizophrenia?" from Public Library of Science)
Limitations
It can be said that a very small error applied over a very large number of individuals (that is, those who are *not affected* by the condition in the general population during their lifetime; for example, over 95%) produces a relevant, non-negligible number of subjects who are incorrectly classified as having the condition or any other condition which is the object of a survey study: these subjects are the so-called false positives; such reasoning applies to the 'false positive' but not the 'false negative' problem where we have an error applied over a relatively very small number of individuals to begin with (that is, those who are *affected* by the condition in the general population; for example, less than 5%). Hence, a very high percentage of subjects who seem to have a history of a disorder at interview are false positives for such a medical condition and apparently never suffered a fully clinical syndrome.
A different but related problem in evaluating the public health significance of psychiatric conditions has been highlighted by Robert Spitzer of Columbia University: fulfillment of diagnostic criteria and the resulting diagnosis do not necessarily imply need for treatment.[1]
See also
A well-known statistical problem arises when ascertaining rates for disorders and conditions with a relatively low population prevalence or base-rate. Even assuming that lay interview diagnoses are highly accurate in terms of sensitivity and specificity and their corresponding area under the ROC curve (that is, AUC, or area under the receiver operating characteristic curve), a condition with a relatively low prevalence or base-rate is bound to yield high false positive rates, which exceed false negative rates; in such a circumstance a limited positive predictive value, PPV, yields high false positive rates even in presence of a specificity which is very close to 100%.[2]
References
- ^ Spitzer, Robert (February 1998). "Diagnosis and need for treatment are not the same". Archives of General Psychiatry 55 (2): 120. doi:10.1001/archpsyc.55.2.120. PMID 9477924. http://archpsyc.ama-assn.org/cgi/pmidlookup?view=long&pmid=9477924.
- ^ Baldessarini, Ross J.; Finklestein S., Arana G. W. (May 1983). "The predictive power of diagnostic tests and the effect of prevalence of illness". Archives of General Psychiatry 40 (5): 569–73. PMID 6838334.
External links
|
||||||||||||||||||||||||||